Inside COT Screener
Divergence: speculators against hedgers
Every futures market is an argument. Speculators take one side, hedgers take the other. This view measures how far apart they stand, market by market, and ranks the loudest disagreements first.
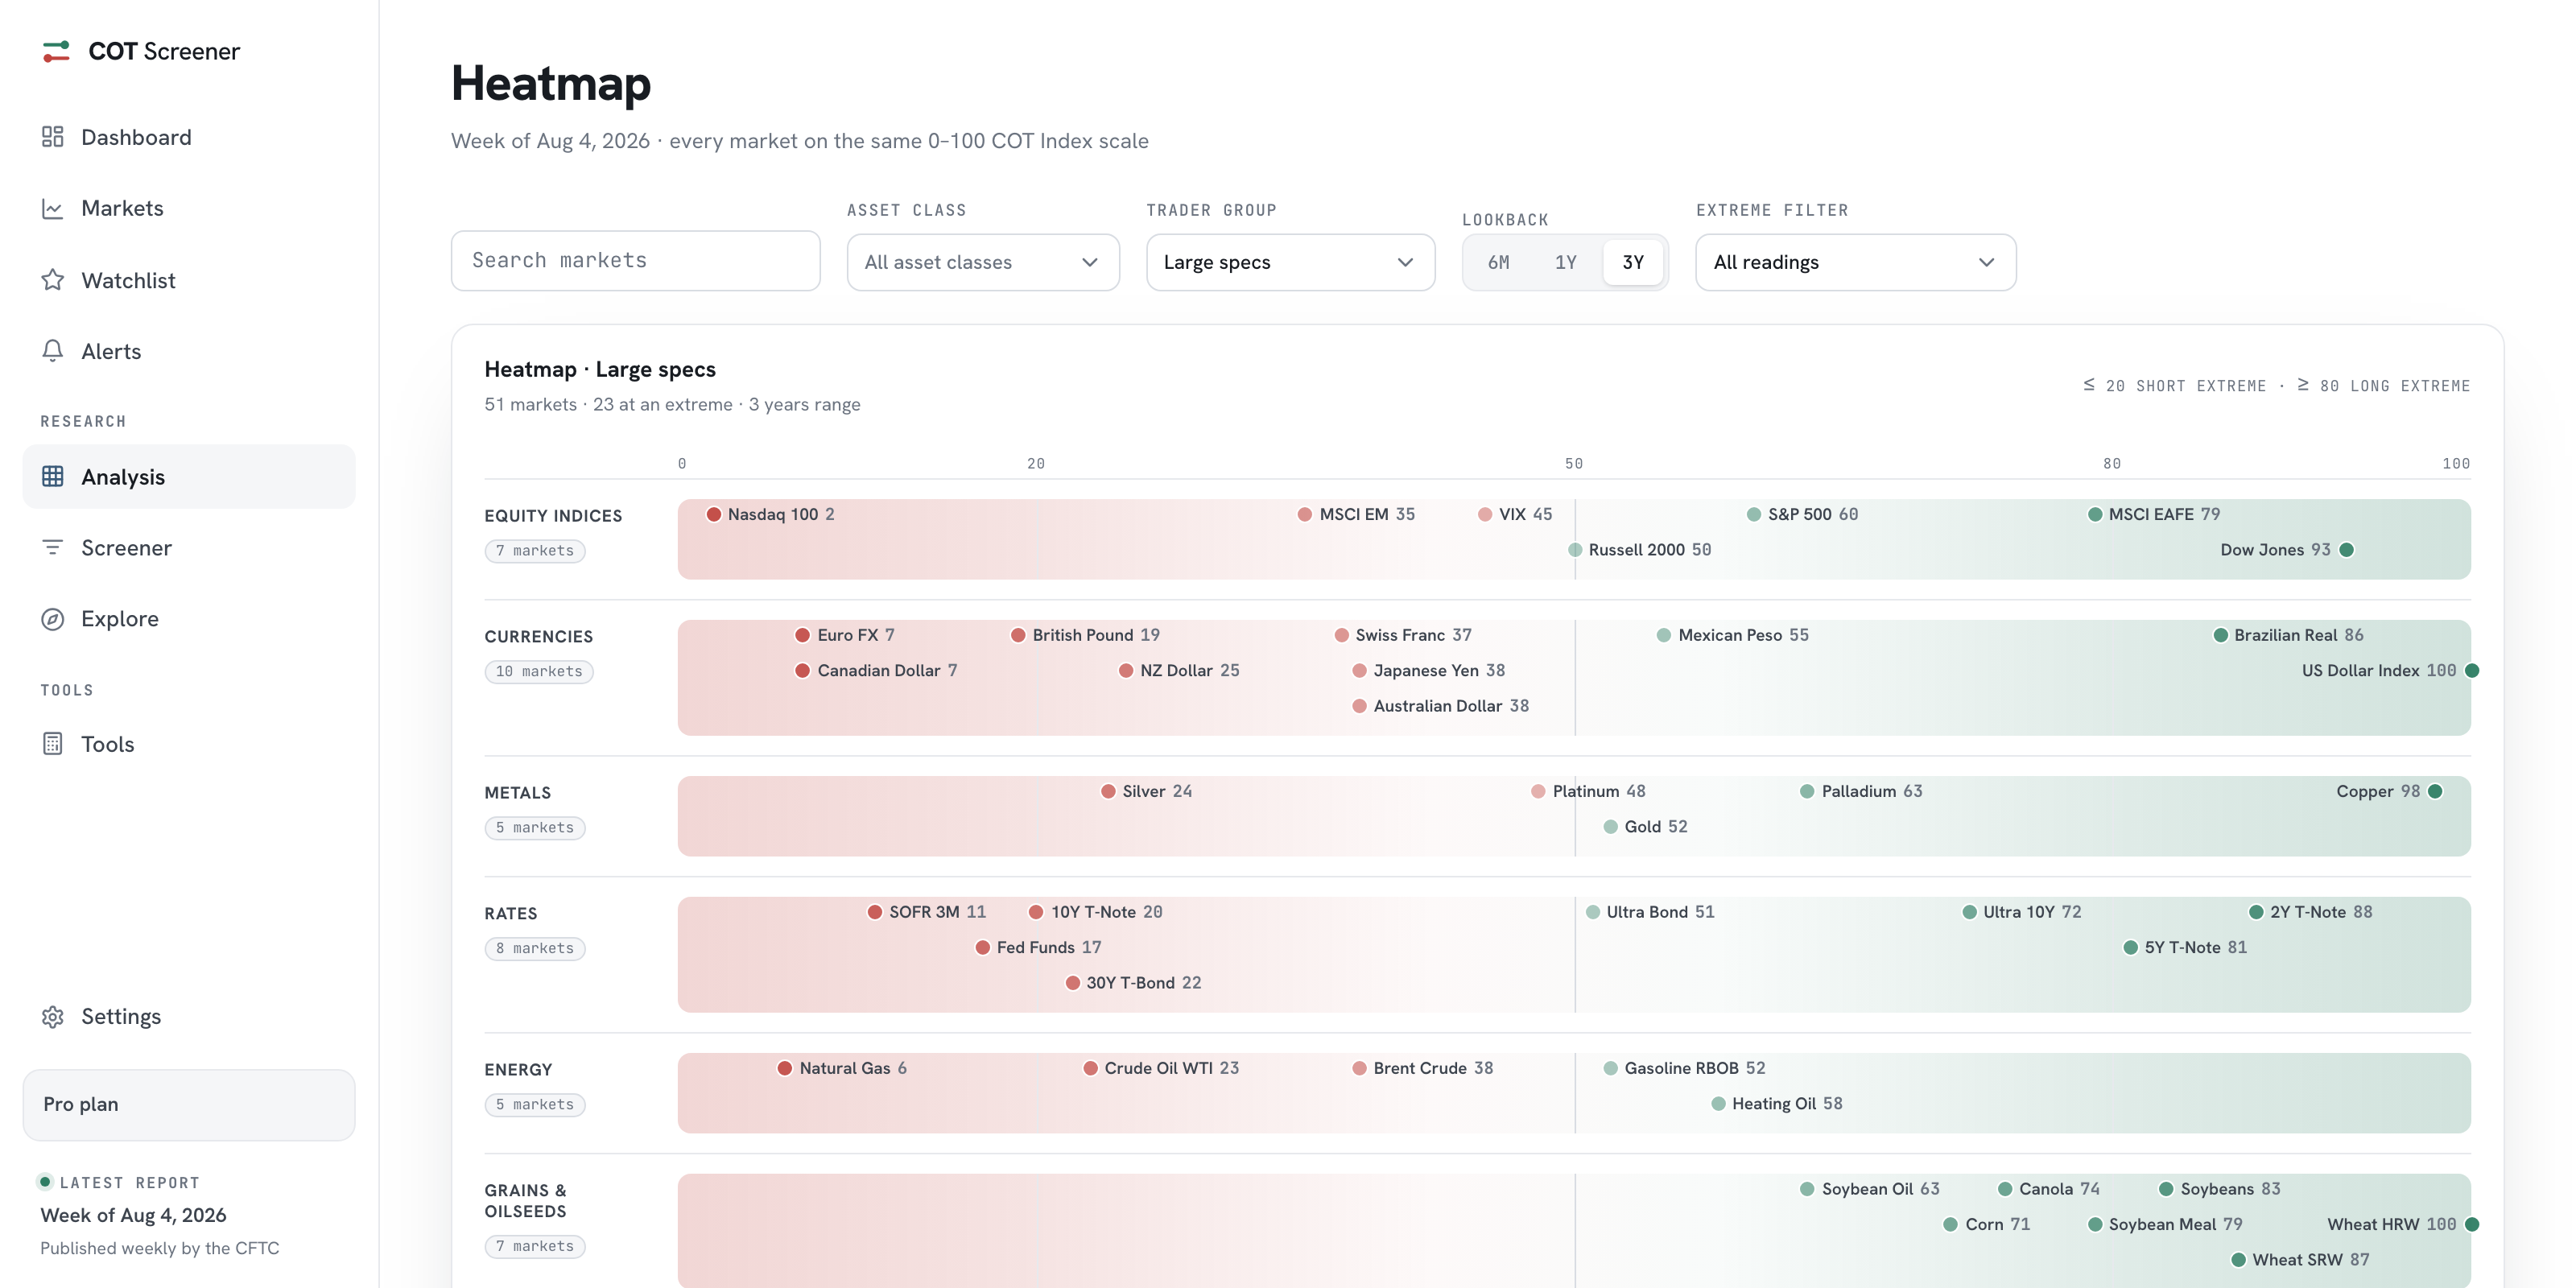
The other analysis pages follow one trader group at a time. The divergence view is built on the relationship between two. Each market becomes one line with two markers: large speculators as the filled dot, commercials as the hollow one, both on the 0 to 100 scale of the COT Index. The screenshots show the week of August 4, 2026.
Reading the dumbbells
The bar connects the two readings, and the GAP column states its width. Colour encodes orientation: green when the speculators hold the long end, red when they hold the short end. The sort puts the widest disagreement on top, so the top of the page is the week’s loudest argument.
In the week shown, three markets stretched the full scale. The US Dollar Index, Wheat HRW and Ether all read a gap of 100. Speculators held one end and commercials the other. The header counted 20 markets at opposite extremes out of 51.
Mirror-image rows are the norm, not the exception, and that is worth internalising. Hedgers sell into speculative buying as part of doing business. What makes a row interesting is the width of the gap relative to that market’s own habit, and the weeks when the gap starts to close.
Filters for the argument
The controls narrow the field: search, asset class and lookback, plus a disagreement menu that keeps only markets past a chosen width, and a sort menu. A checkbox adds small traders as a third marker per row. There is no trader group menu here, because both groups are always on stage.
From gap to story
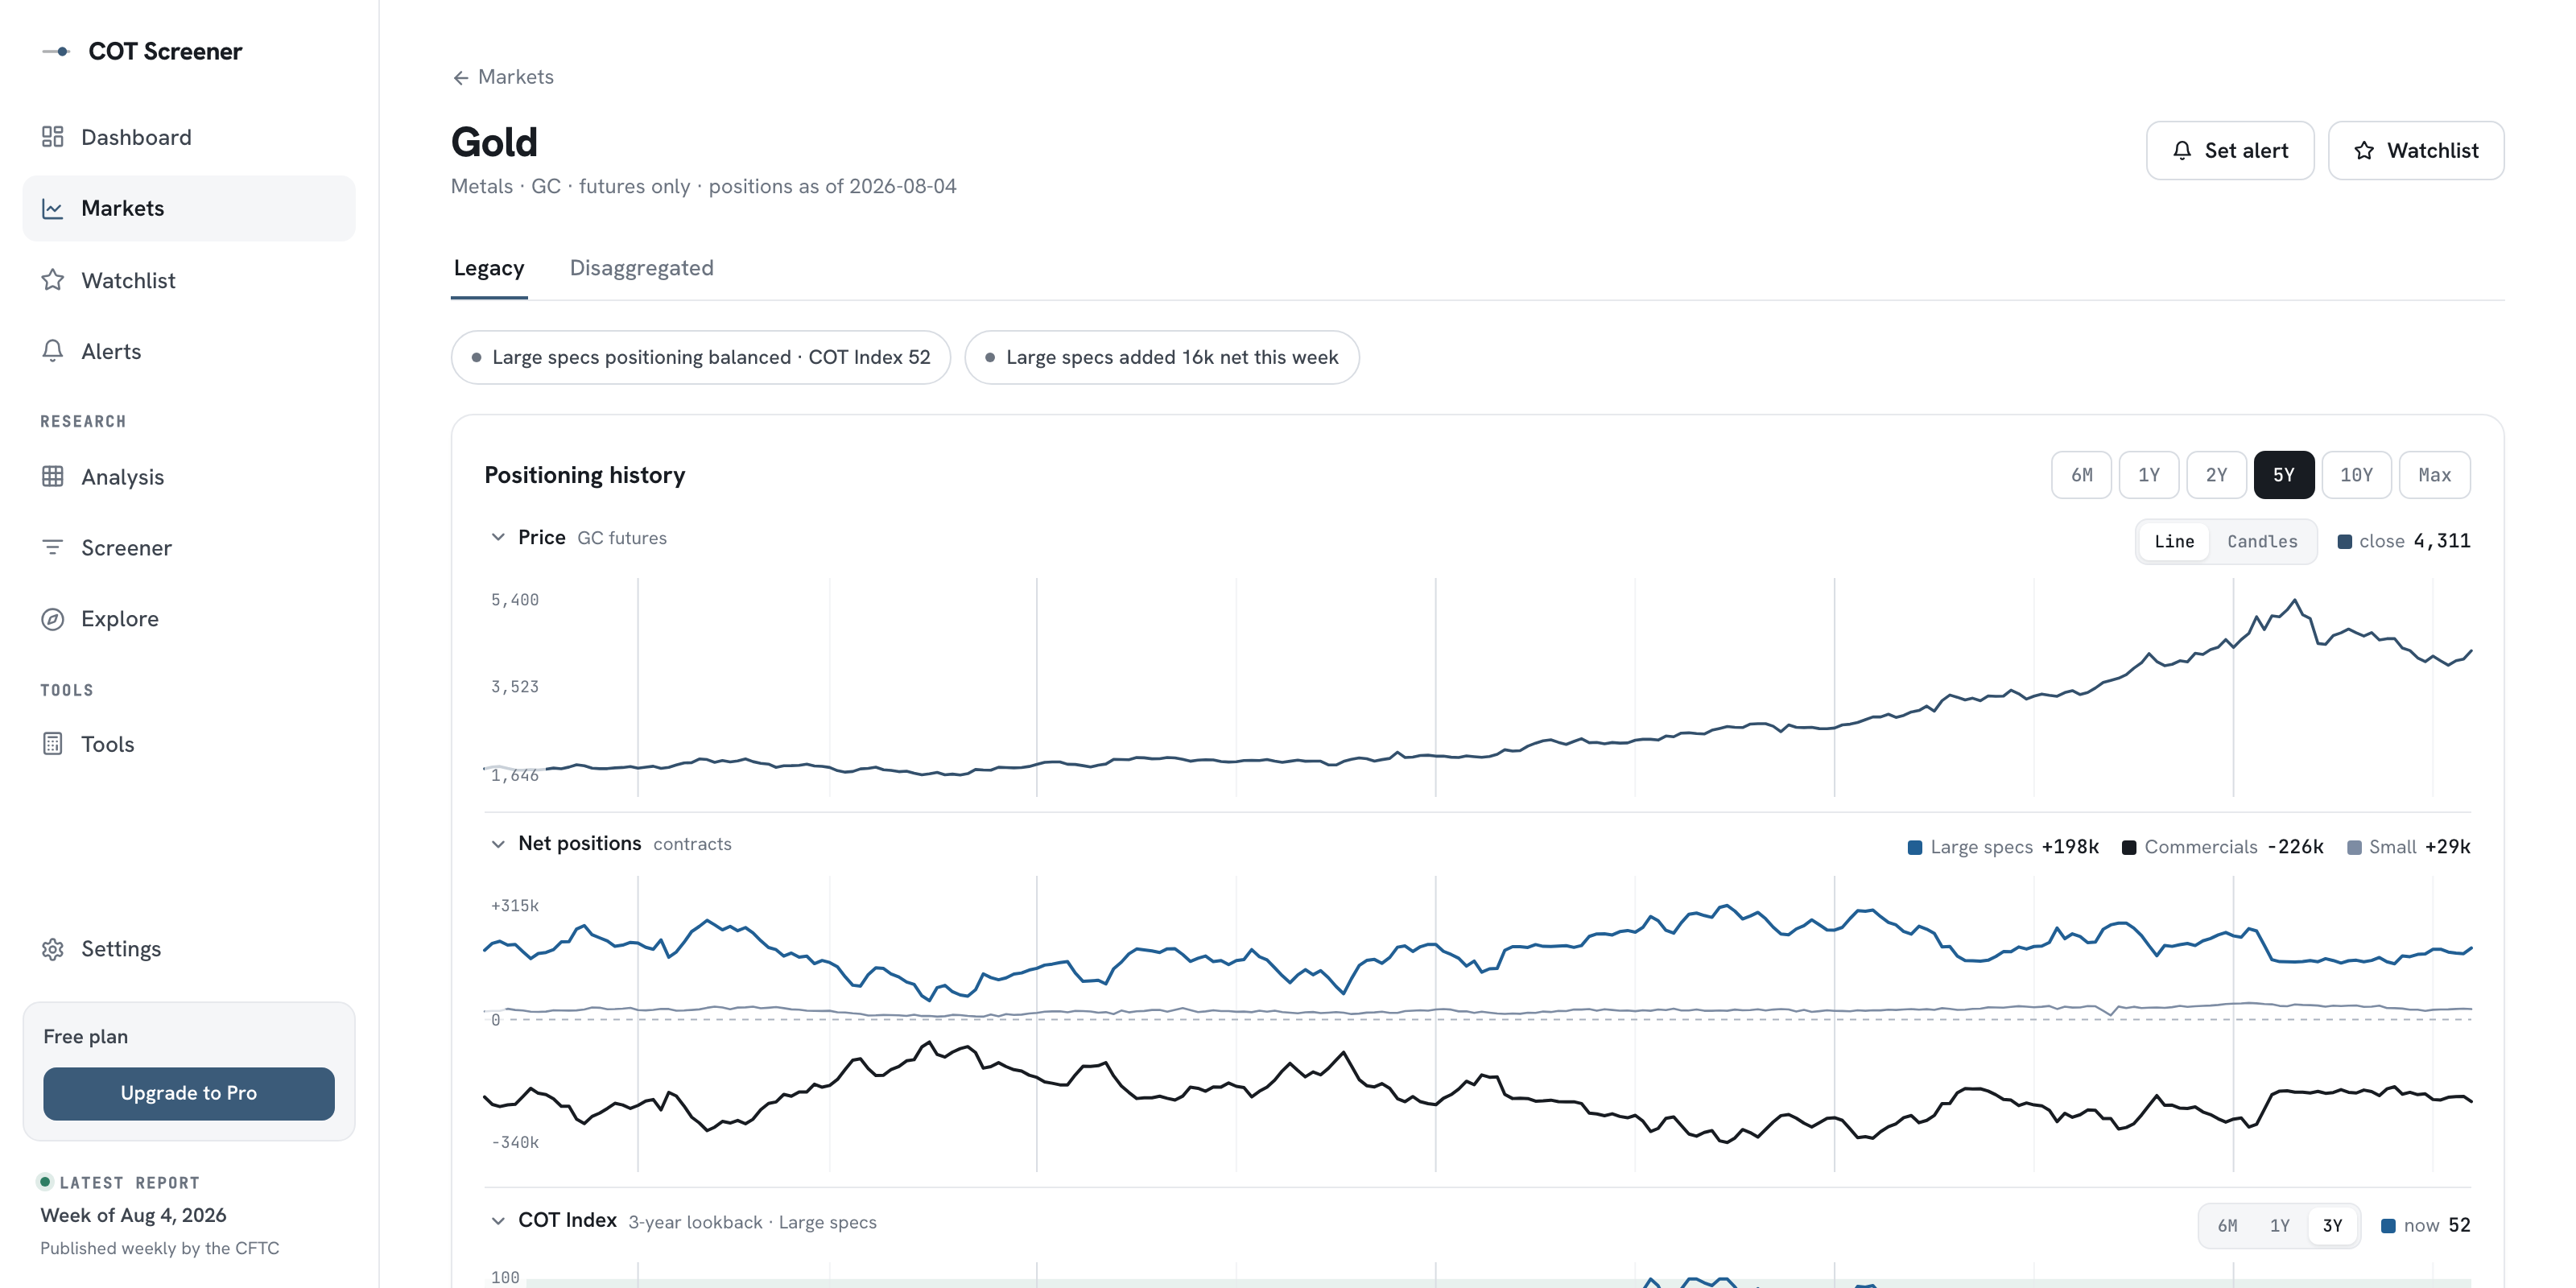
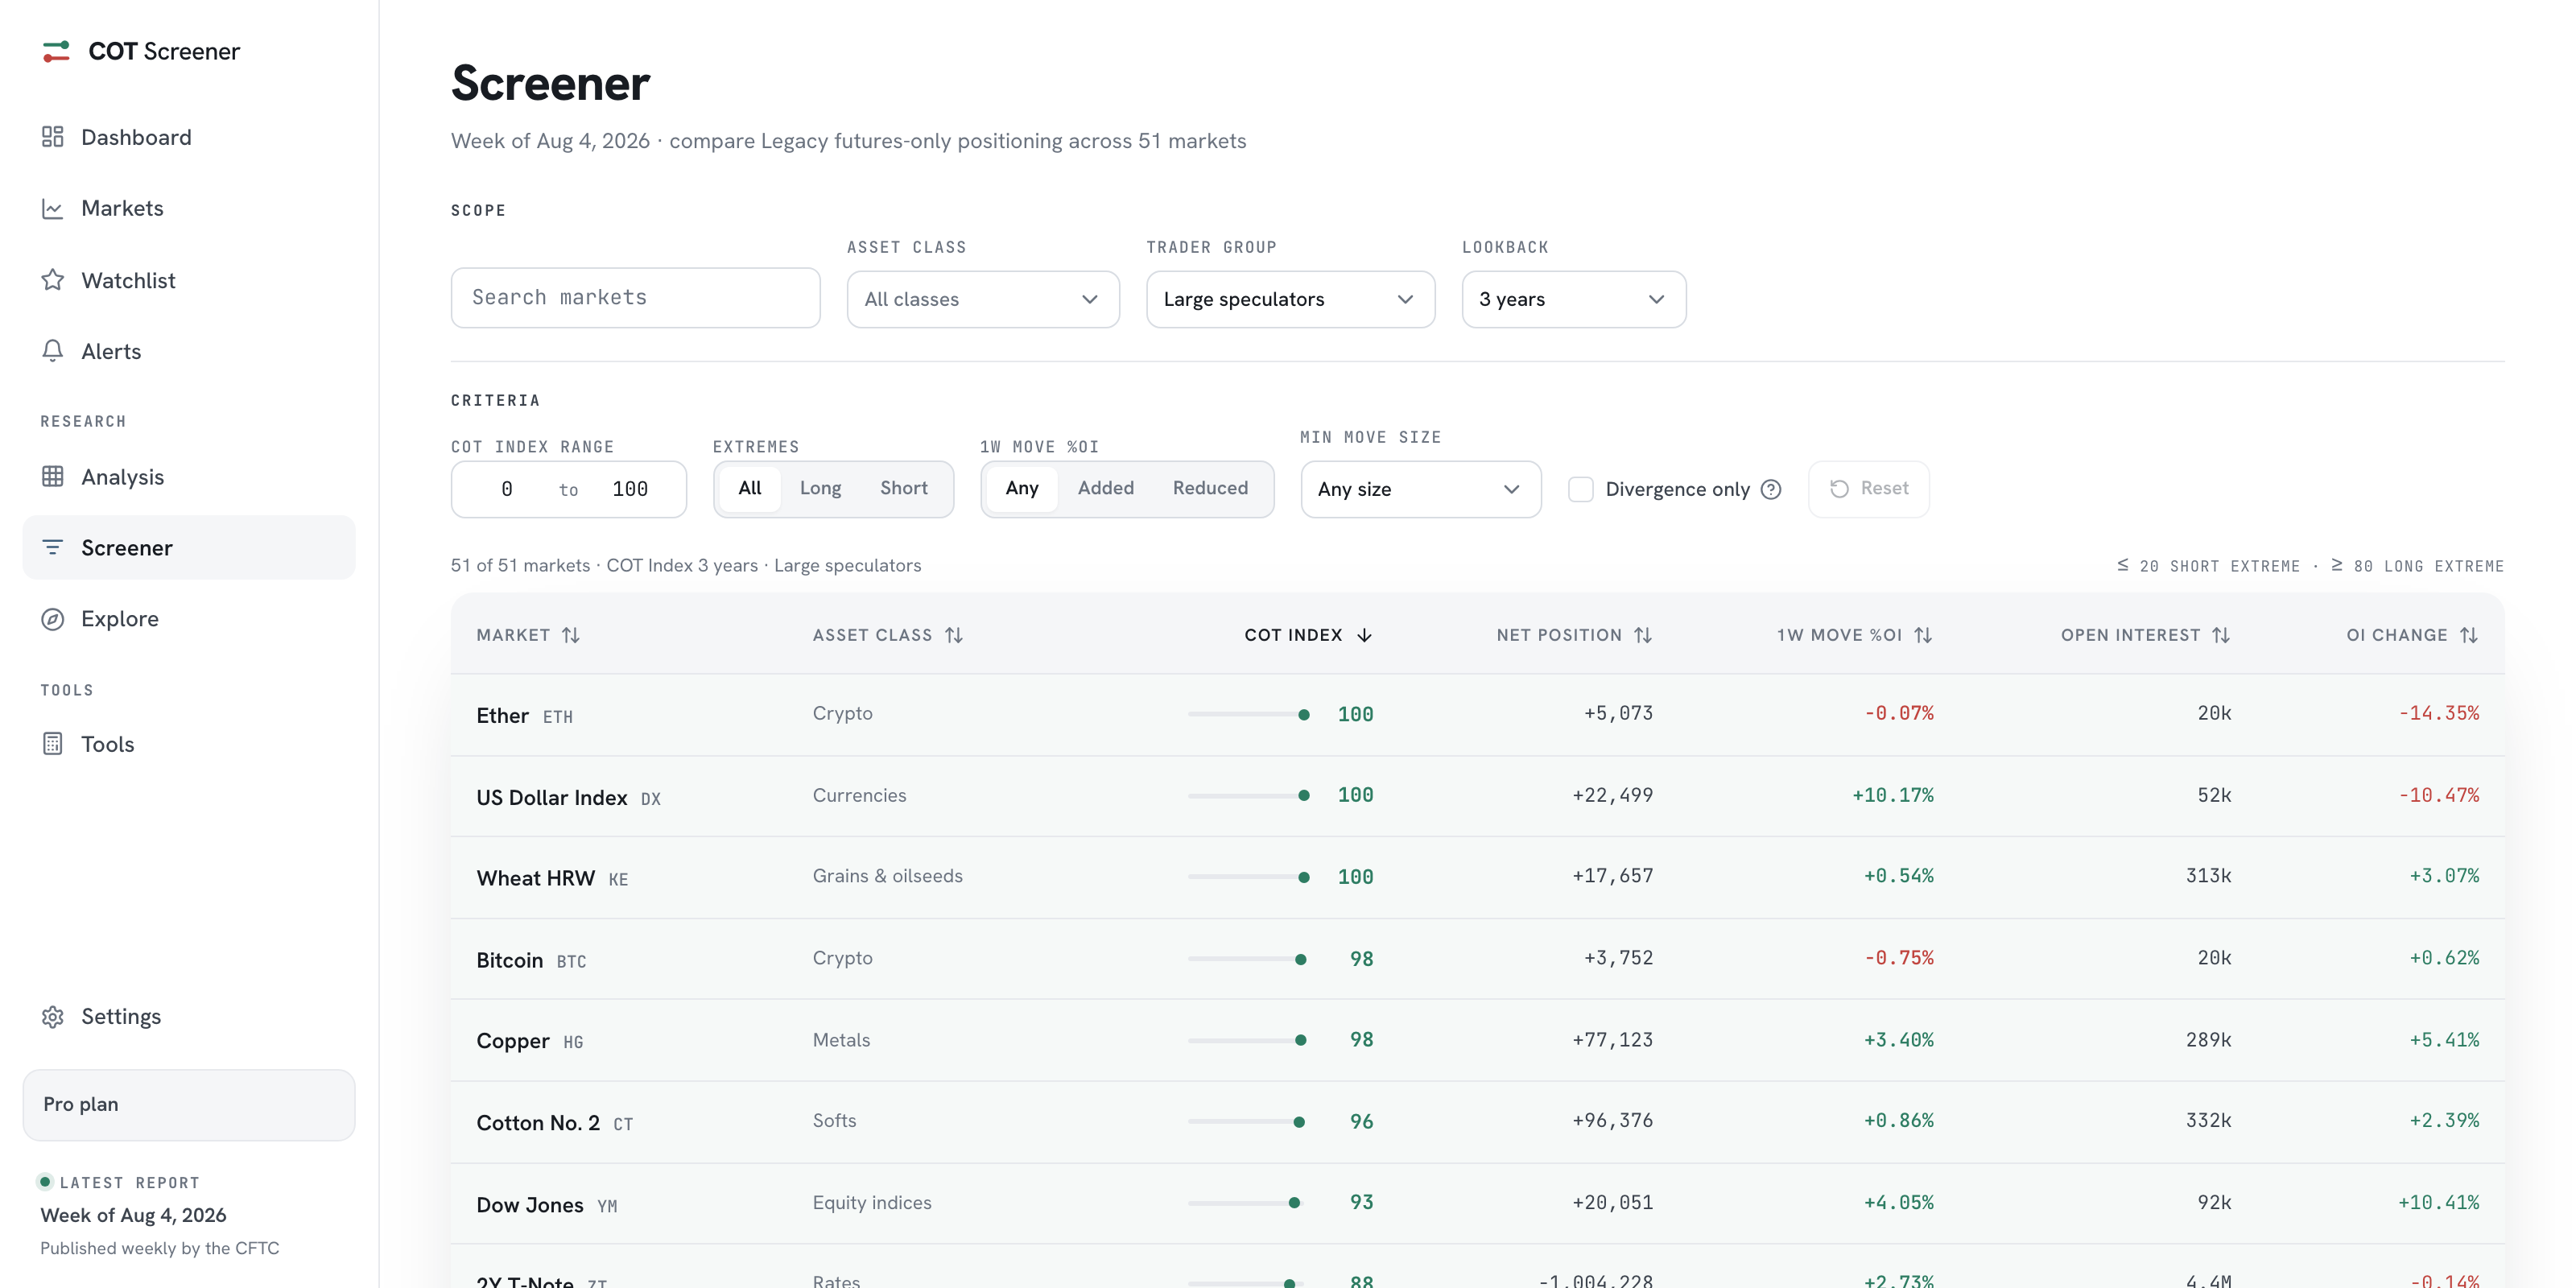
A wide gap earns a click into the market page. Its net positions panel shows the two lines pulling apart over time, and the long and short breakdown shows which side each group actually grew. The screener carries the same idea as a filter: its divergence switch keeps only these opposite-extreme markets while you stack further criteria on top.
Common questions
Is a wide gap bullish or bearish?
Neither, by itself. It measures disagreement, not direction. The colour tells you which side the speculators are on; what happens next is what the weekly follow-up is for.
Why do the two groups mirror each other so often?
Futures are zero-sum: every long faces a short. When speculators accumulate longs, hedgers are usually the ones selling to them. The commercials guide explains why that is business, not opinion.
What counts as opposite extremes here?
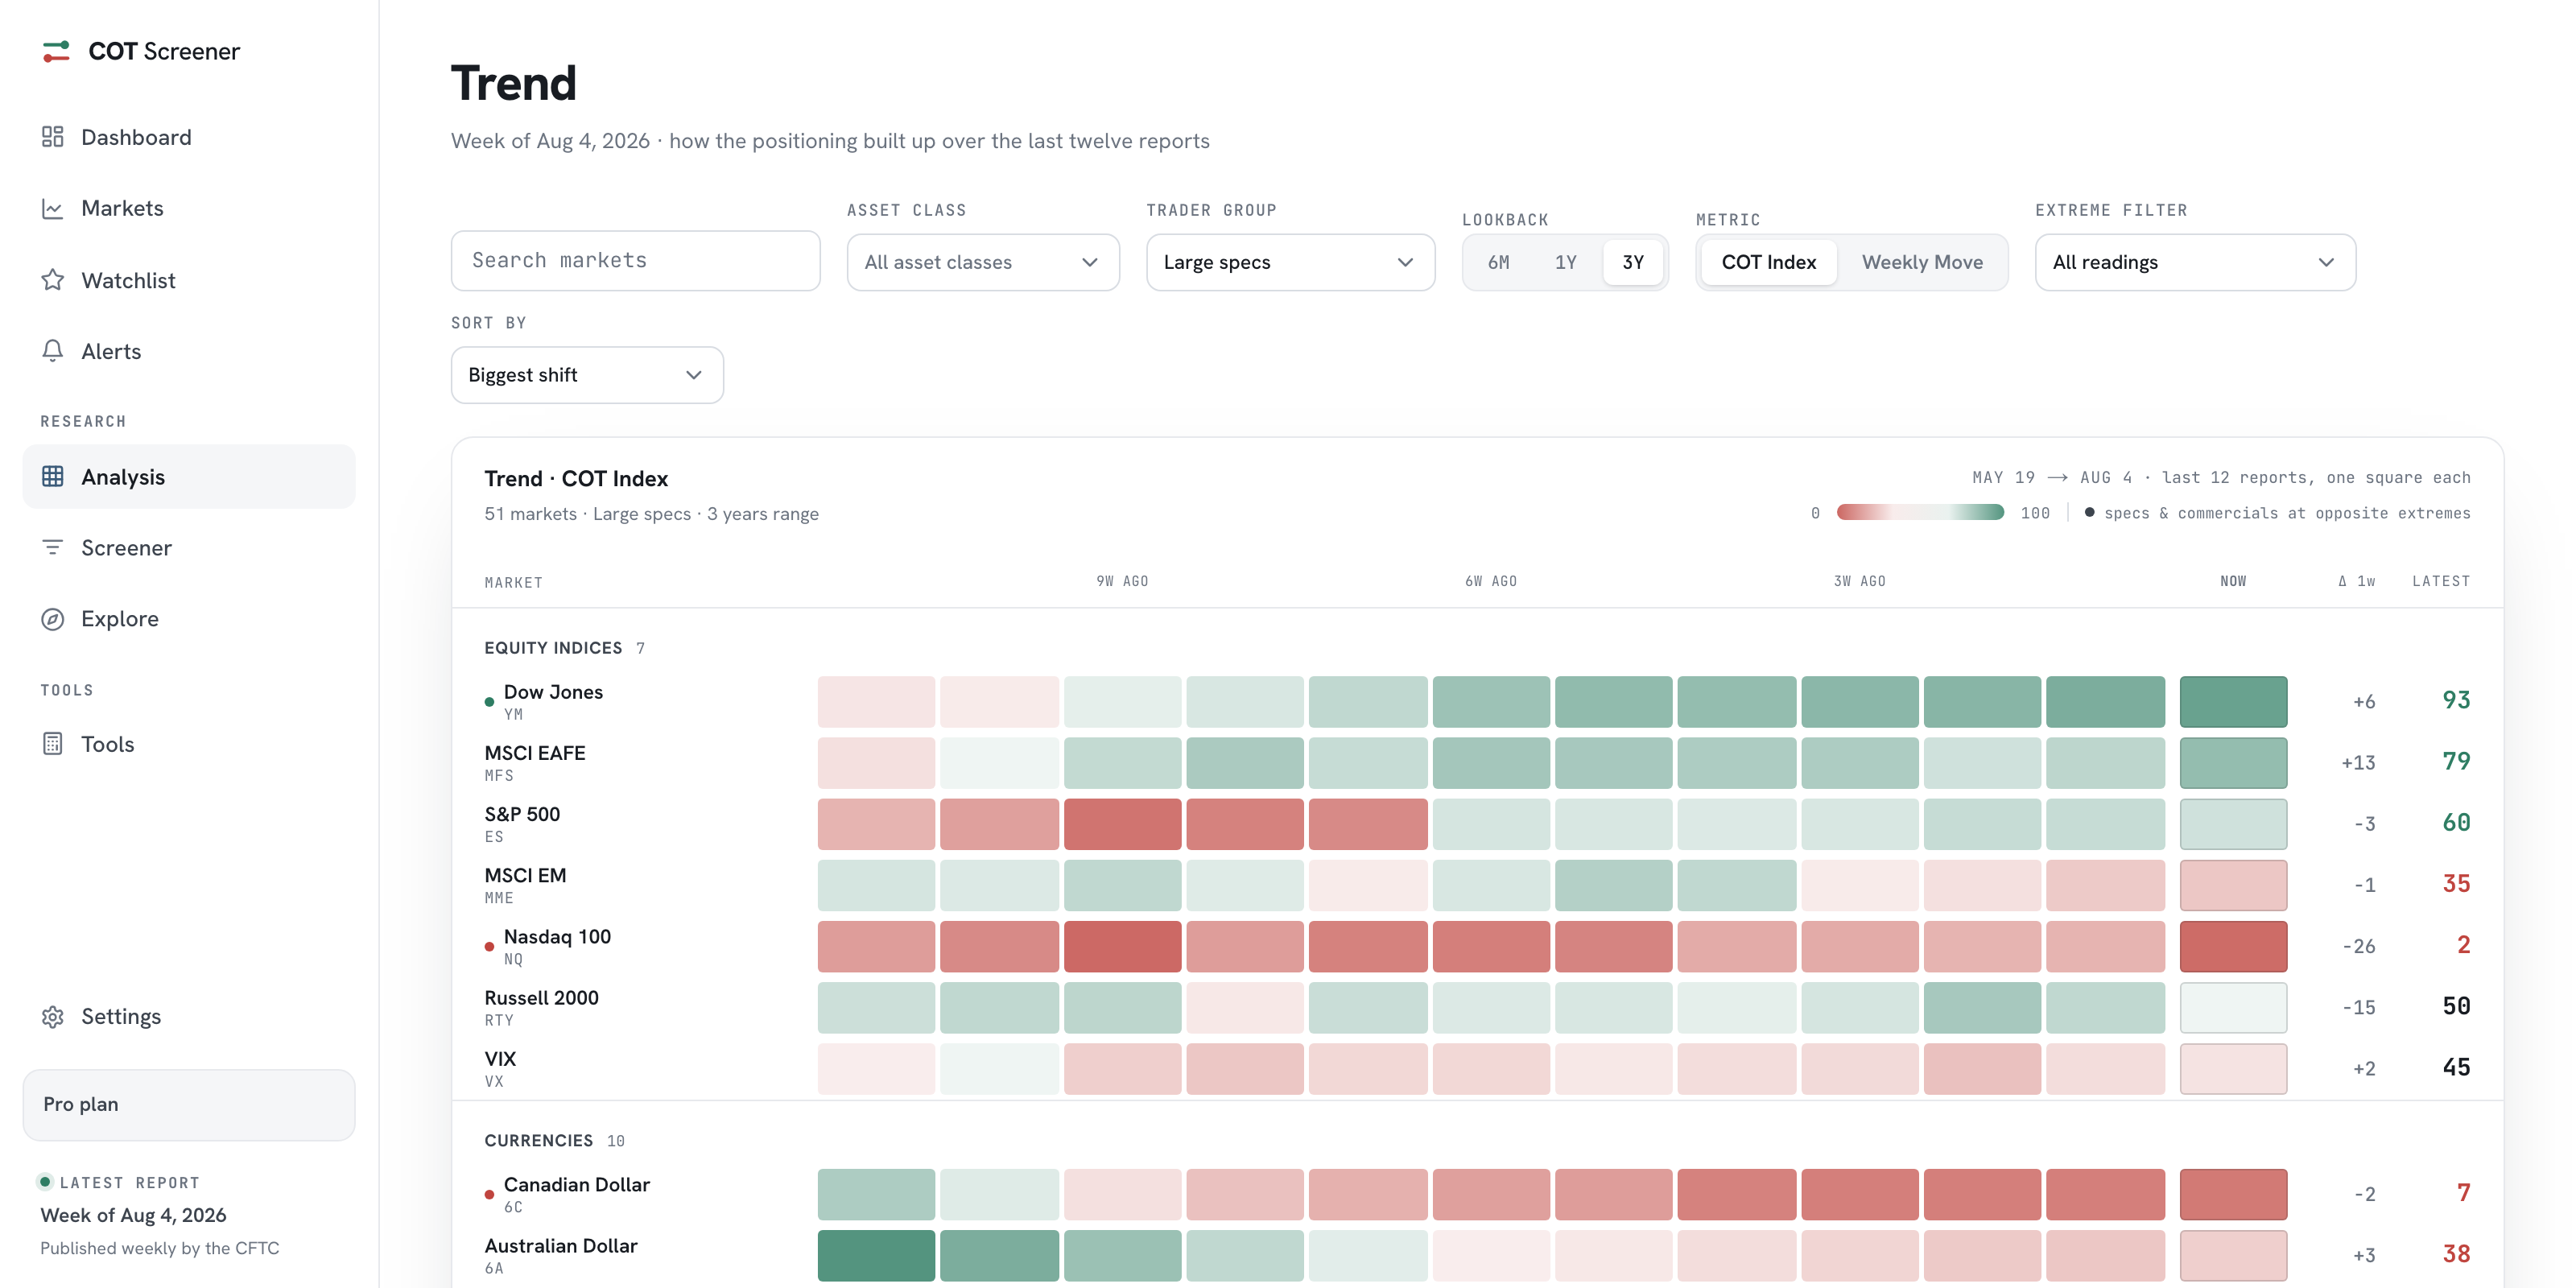
The same rule as everywhere in the app: one group at 80 or above while the other sits at 20 or below. The header counts how many markets qualify, and the trend view marks them with a dot.
What does the small traders checkbox add?
A third marker per row, so you can see where the smallest reported accounts stand relative to the two big groups. It is off by default to keep rows clean.