Inside COT Screener
Inside the market analysis page
Every market in COT Screener opens onto the same page: what the largest traders hold, how that compares with the past, and the report behind it. This is a walkthrough of that page, top to bottom.
The page answers two questions about one market. Where does positioning stand right now? And how did it get there? Everything on it works toward those two answers, from the headline pills to the full report archive at the bottom.
The screenshots in this article show Gold in the reporting week of August 4, 2026. The numbers are frozen there on purpose. Open the same page in the app and you will see the latest release instead. The layout is identical for every market.
The header reads itself first
The top row names the market, its group, its ticker symbol and the report date. Two buttons sit beside it. Set alert saves a COT Index trigger for this market, and Watchlist pins it to your board. Both feed the weekly routine described in watchlist and alerts.
Below that, the page states its own summary. Short signal pills describe the week in plain sentences before any chart appears. The first pill always places the main trader group on the 0 to 100 scale of the COT Index. Readings of 80 or more are called a long extreme, 20 or less a short extreme. Readings around the middle count as balanced, and the bands in between lean long or short.
More pills follow only when the data earns them. One names the group with the largest net change of the week. A commercial position near a multi-year record gets its own pill. So does a weekly move in open interest of four percent or more.
Positioning history: four panels, one clock
The centrepiece is one chart with four stacked panels on a shared time axis. Price sits on top, then net positions, then the COT Index, then open interest. Because the panels share their clock, you read one moment vertically across all four.
- Price shows the futures contract the report describes, as a line or as weekly candles. Markets without a clean price source skip this pane.
- Net positions draws each trader group as its own line, long minus short in contracts. For the Legacy report that means large speculators, commercials and small traders. The net positions guide covers the calculation.
- COT Index rescales the main net position to 0 to 100. The lookback switches between six months, one year and three years.
- Open interest counts the contracts open in the whole market, week by week. Open interest in the COT report explains why it moves.
Time is under your control in three ways. Range buttons run from six months to the market’s full record. The brush strip under the panels shows the whole history, and its window drags to any period. The From and To fields take exact dates. On long ranges, a dashed marker labels where the synced price history begins, so a shorter price series never masquerades as the full record.
The chart also stays out of your way. Every panel collapses behind its own chevron, and the app remembers which ones you keep open. Hiding a series from the legend removes it and rescales the axis to what is left. The hover readout follows every visible series at once.
The COT Index in three windows
The chart shows one lookback at a time. The card below shows all three at once, and that comparison is the point. In the week photographed, Gold read 100 against six months, 39 against one year and 52 against three years. The same net position was a six-month high and, at the same time, unremarkable against three years.
What counts as an extreme, and how long readings can sit at the edge, is its own topic. The extremes guide covers it. Next to the index card, Concentration shows the share of open interest held by the four and the eight largest traders, long and short. It tells you how few books carry each side.
The report, exactly as published
Everything above this card is computed. This table is not. It is the report as the CFTC publishes it, cell for cell. Positions per category, the change against the prior week, each column’s share of open interest and the number of traders behind it. The bars underneath restate each group’s gross long and short sides, spreading excluded. If you have read a raw CFTC release, you know this layout already.
The date button on the card opens any earlier week. Pick one and the table and bars rebuild for that report, while the charts above stay on the present. Tabs at the top of the page switch the report family. Every market carries Legacy. Physical markets add Disaggregated, financial markets add Traders in Financial Futures. The report types guide explains how the families differ.
Weekly changes, in sequence
Recent history lists the reports themselves, newest first. Each row is one reporting Tuesday. You see open interest and, per group, the net position with its weekly change. The triangles mark direction, so a scan down a column shows accumulation or distribution at a glance. A control below extends the list from 12 weeks to 26 or 52.
The counter under the table states how deep the record goes. In the week shown, Gold stood at 1,928 reports. Long-running markets reach back into the 1980s.
Long and short, separated
A net number can hide as much as it shows. Two groups can both grow their longs and shorts and report the same net as before. The last two cards split the sides open: one for all long positions, one for all short. Each shows contracts per group over time, then every group’s share of that side. Who owns the long side, and who owns the short side, stops being a guess.
The two cards are deliberately identical in layout. Reading them as a pair shows each group’s role from both directions. In the week photographed, large speculators dominated Gold’s long side while commercials carried most of the short side. The commercials guide explains why the sides are usually mirror images.
Where the page hands off
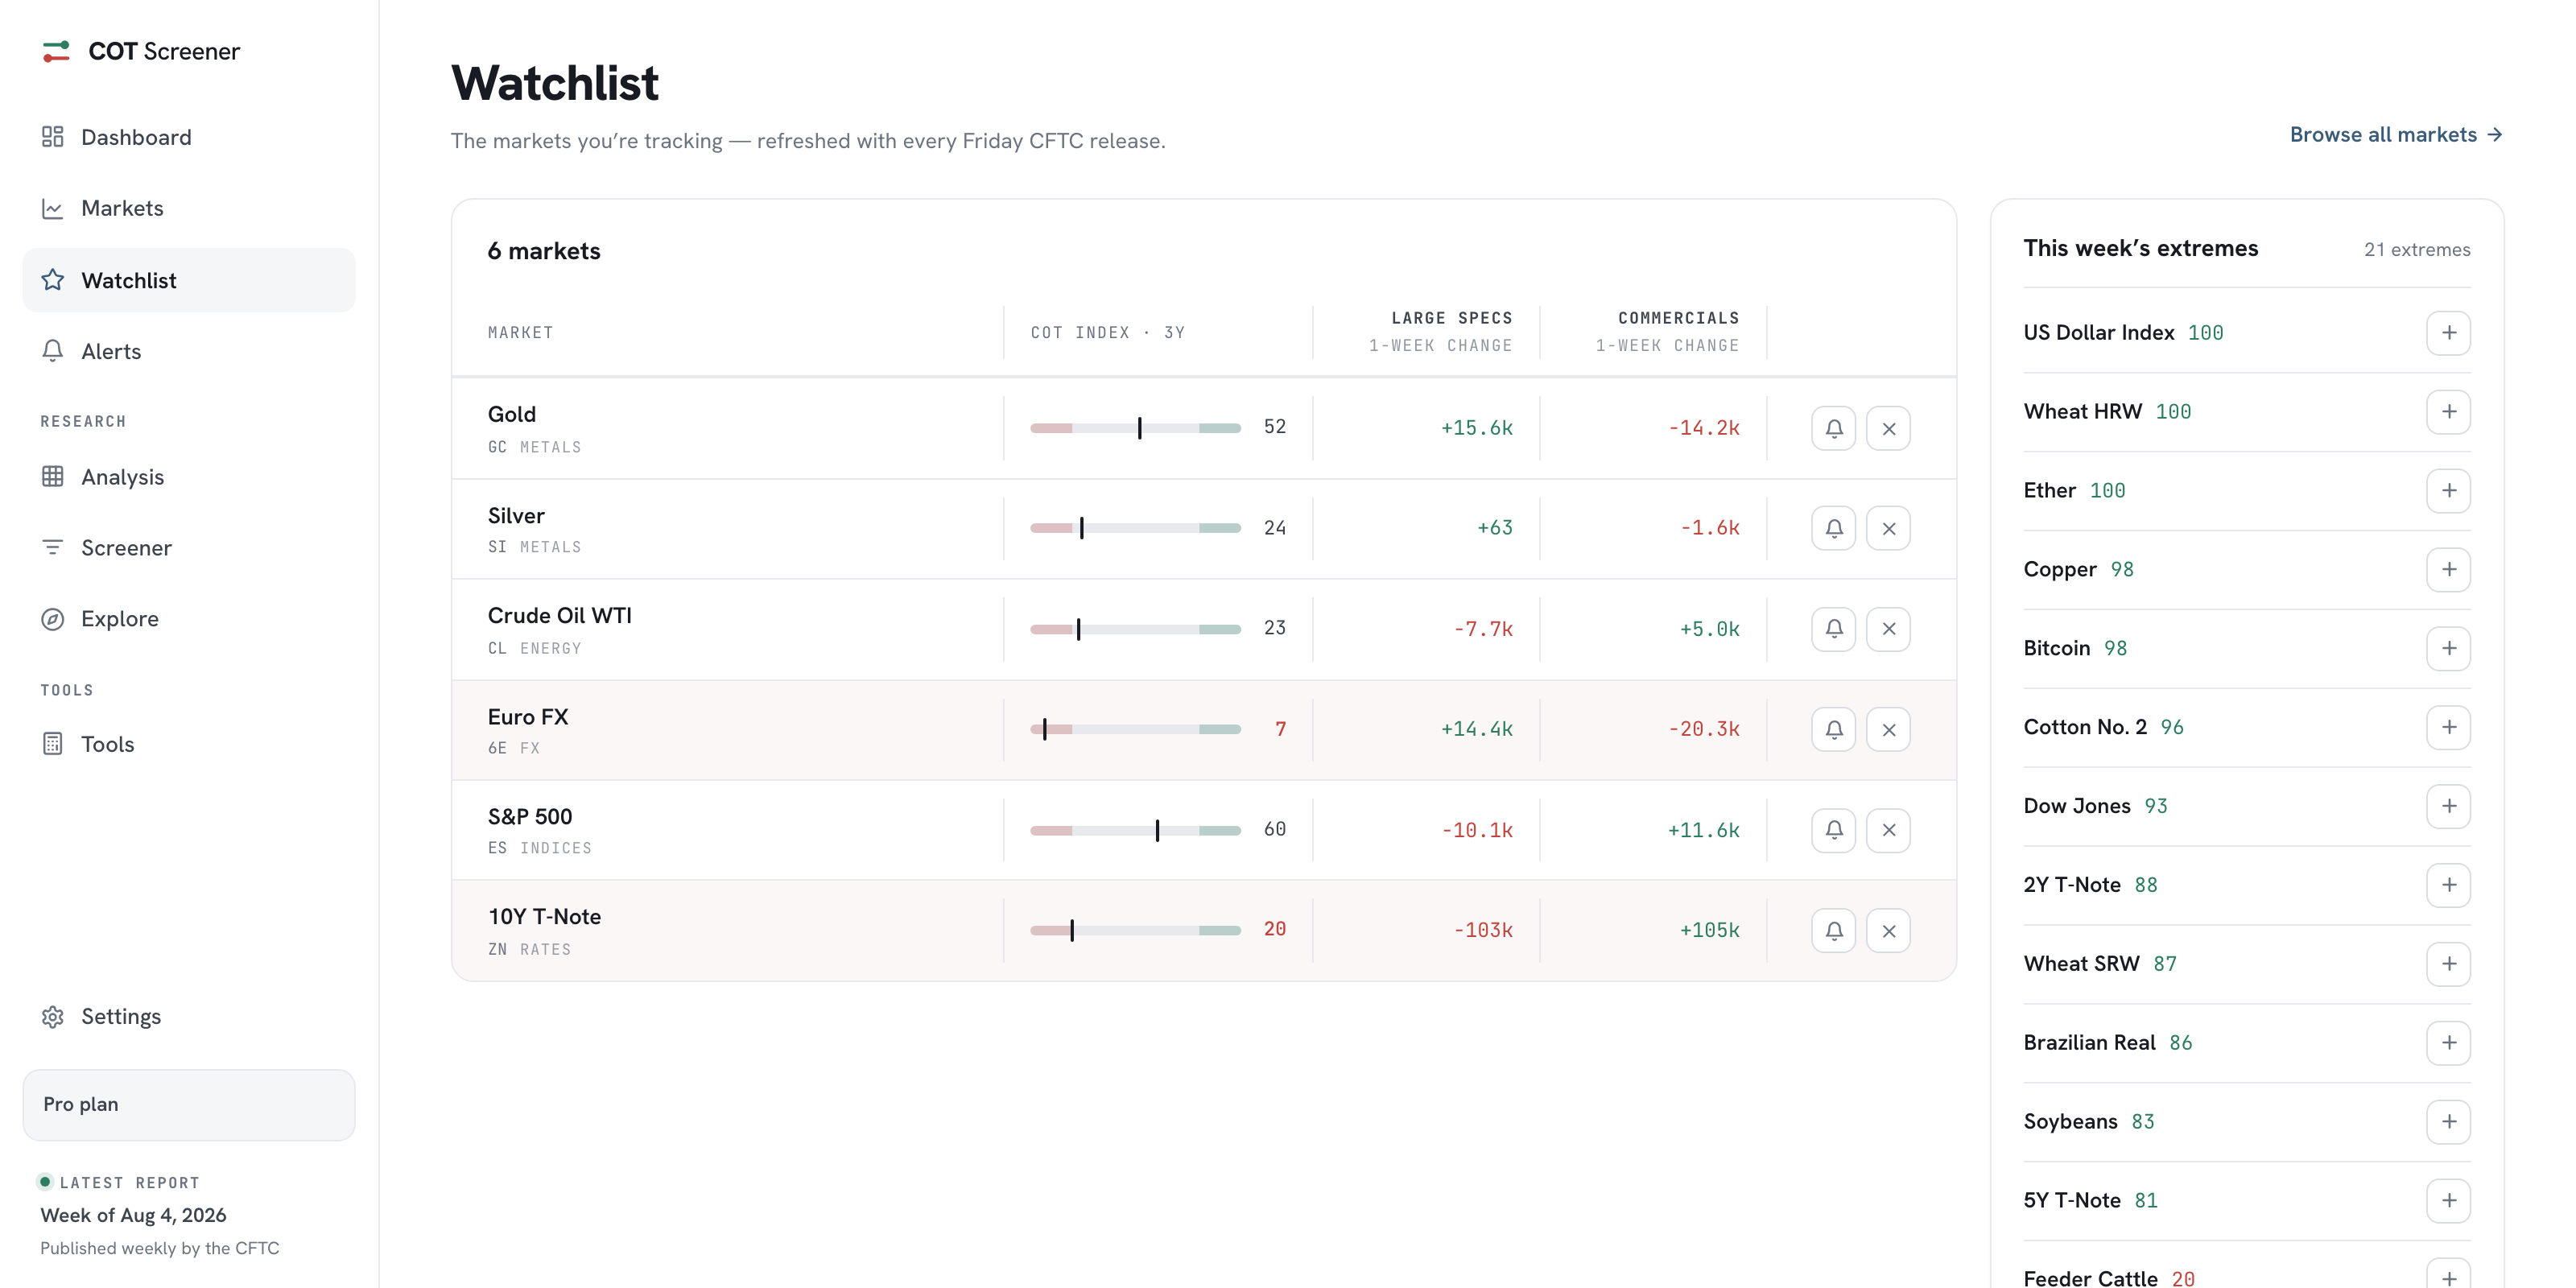
The page is built to be left. Watchlist puts the market on your dashboard, where the board tracks it every week. Set alert saves a COT Index level, and the alerts page shows the trigger waiting. The back link returns to Markets, and Explore opens the same analysis for every other market the CFTC publishes. When you want the opposite direction, from all markets down to a shortlist, start at the screener instead.
Common questions
Which markets get this page?
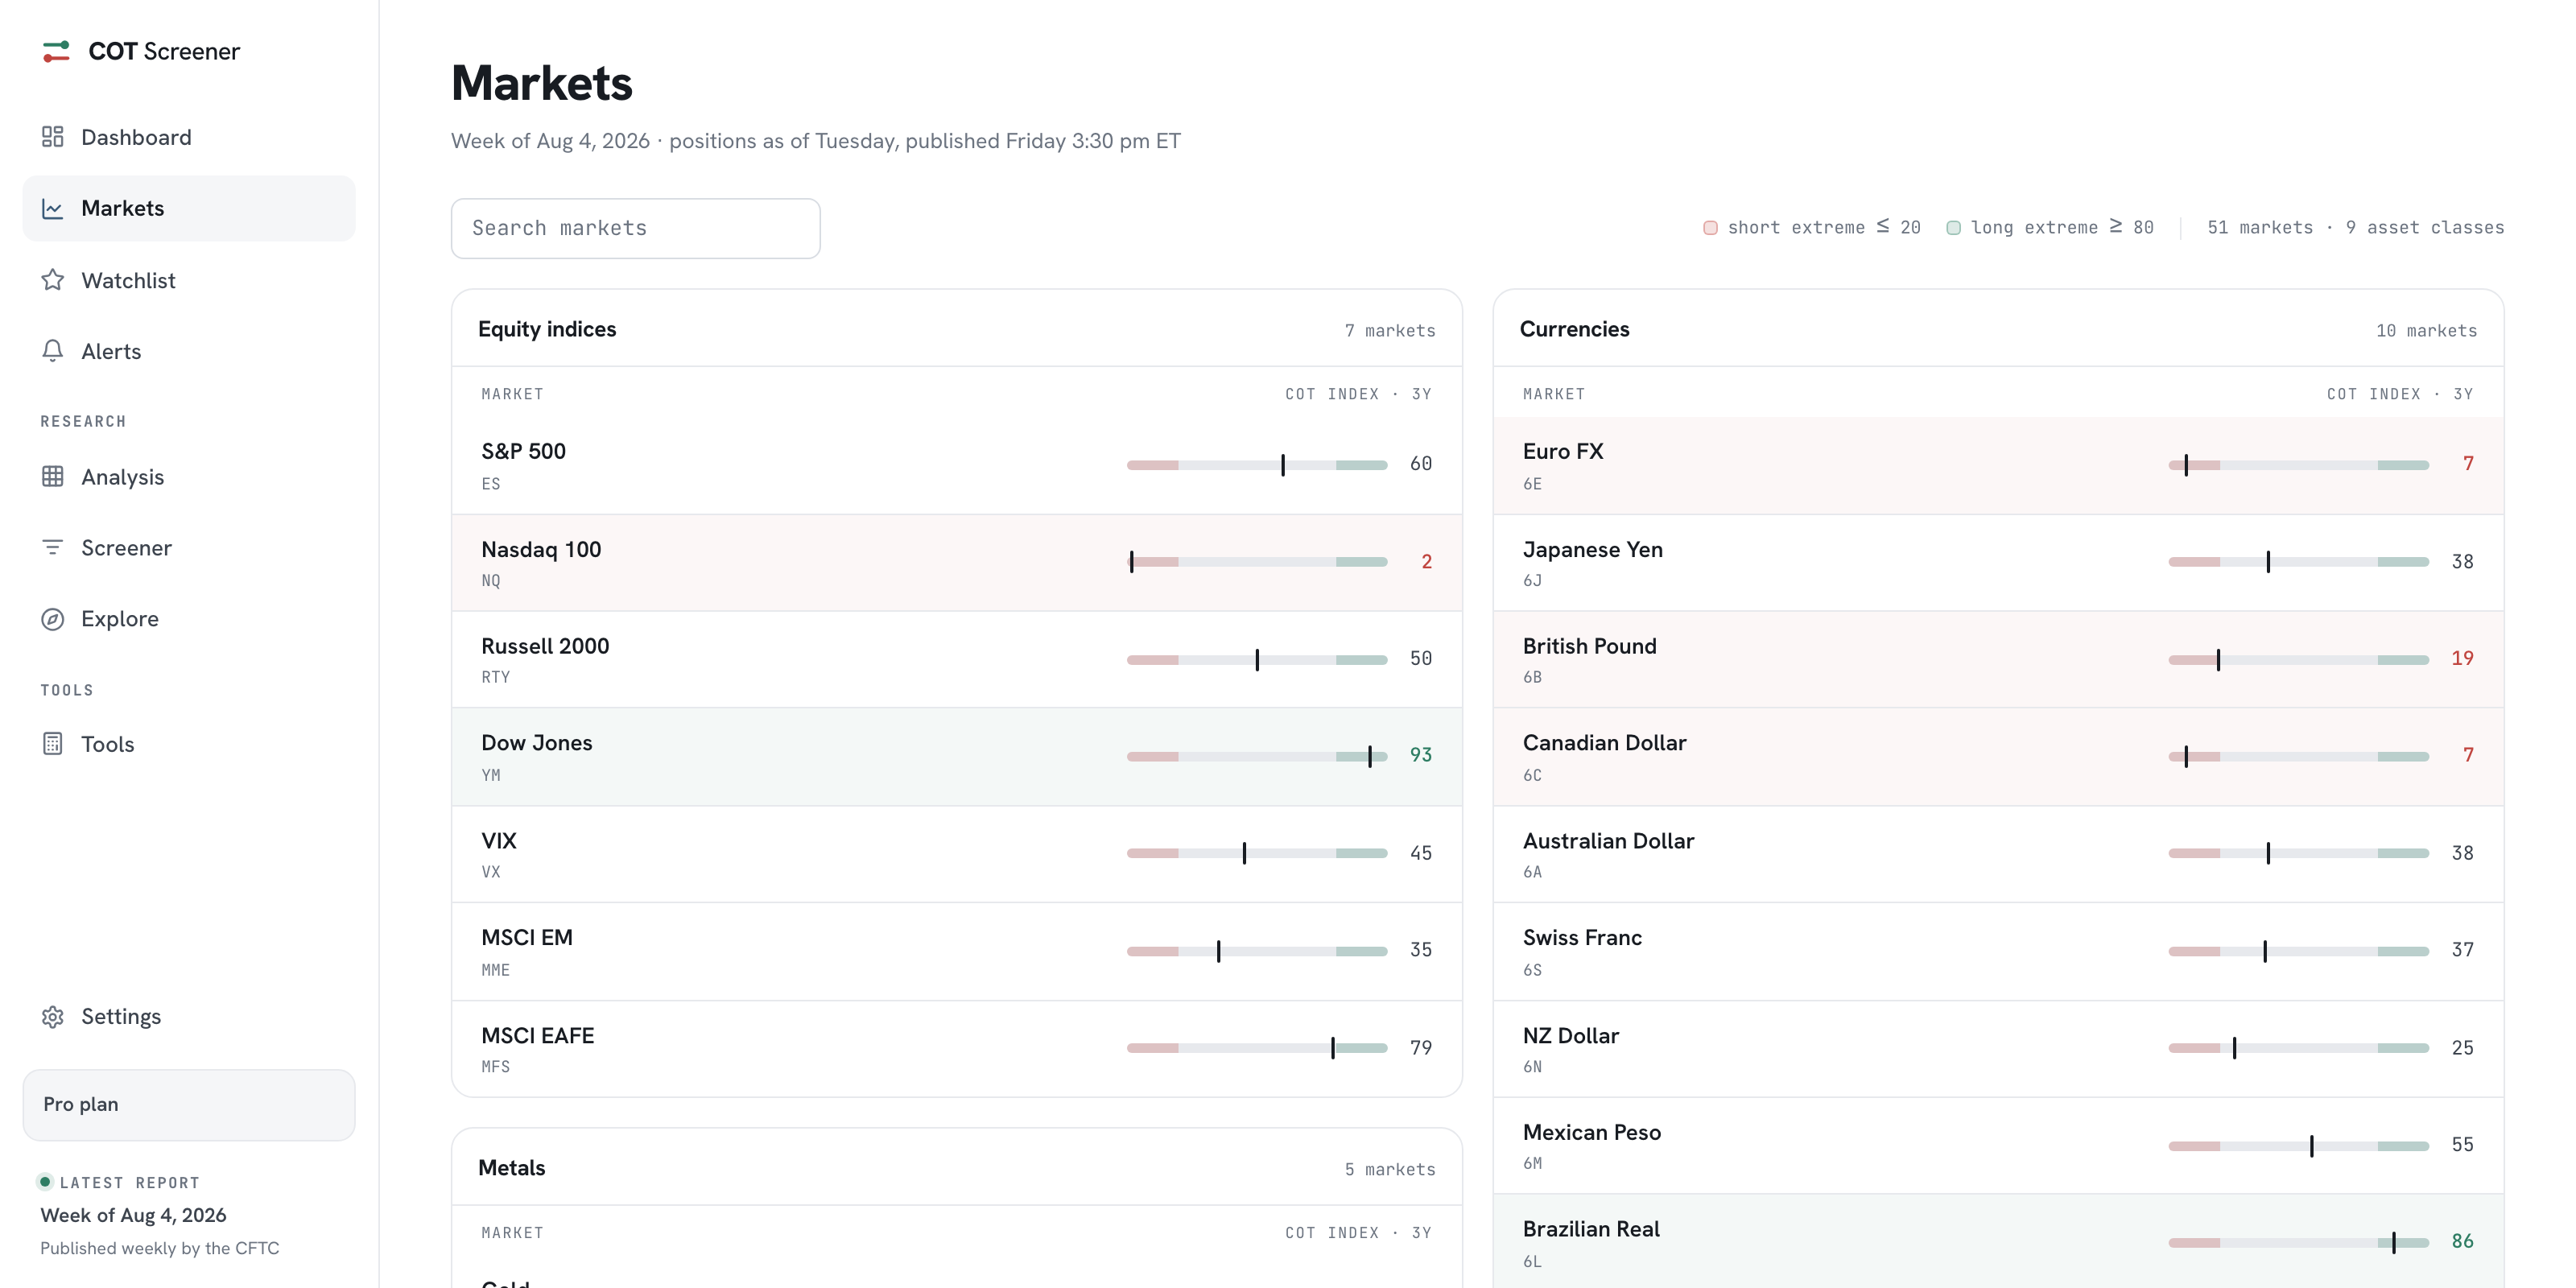
All of them, in the same layout. The Markets page curates the widely followed contracts, and Explore lists every other market the CFTC publishes, over 360 in total. Each one opens this analysis.
How current is the data?
As current as the report itself. The CFTC records positions as of Tuesday and usually publishes on Friday; the page updates after each release. The schedule guide explains the timing in detail.
What does the free plan include here?
The free plan opens five major markets with a COT Index over one year of history. Pro opens all 360+ markets, the archive back to 1986, all three lookback windows and alerts on any market.
Do I need to understand the COT report first?
No. The signal pills state the week in plain sentences, and every number on the page is labelled. For the background, start with what the COT report is and how to read it.